

Enterprise-grade platforms have to integrate with other enterprise solutions in order to be effective. SCYTHE focuses on providing business value through adversary emulation and showing whether security tools and controls are properly implemented and tuned to detect malicious behavior. To implement an enterprise solution, SCYTHE integrates with other solutions such as Splunk, PlexTrac, VECTR, and virtually any solution or SIEM via syslog.
This post covers how to integrate your SCYTHE instances with Splunk as well as a project by Splunk’s Security Strategist, Tim Frazier, called ATT&CK Simulator. ATT&CK Simulator brings a number of components together for automating adversary emulation and correlating with detective data in Splunk. ATT&CK Simulator leverages Splunk’s Phantom runbooks to run SCYTHE campaigns via SCYTHE API and then correlates the attack data with Splunk’s detective data (logs from sysmon, windows event, etc), including Olaf Hartong's ThreatHunting App (we spoke with Olaf and introduced Sysmon in our Ransomware #ThreatThursday).
ATT&CK Simulator
We linked up with Tim Frazier, Splunk’s Security Strategist and creator of ATT&CK Simulator, along with Kyle Champlin and David Herrald, to discuss this new tool. ATT&CK Simulator integrates ATT&CK Navigator, SCYTHE, Phantom, Olaf Hartong's ThreatHunting App, and Splunk to run automated adversary emulation campaigns that correlate with detection data. As documented in the Github readme, you will be able to repeatedly execute specific techniques, observe the resulting events in Splunk and refine your detection rules and methodology.
At a high level and all from within Splunk:
- User selects which TTPs to emulate from an ATT&CK Navigator view.
- In the backend, Simulation Runner (Splunk App) talks to Phantom which talks to SCYTHE API to execute a campaign.
- Phantom downloads and executes the SCYTHE dropper in the target system that was selected.
- All automated adversary behaviors of that campaign are executed on the system and, in real time, sends the SCYTHE campaign data to Splunk.
- The endpoint logs the activity locally with Olaf Hartong's ThreatHunting App.
- Splunk Forwarder on the endpoint sends the detection logs to Splunk for correlation.
- Users can see which TTPs were executed successfully and the correlated detection data that triggered.
Tim and team will be speaking at Blackhat Arsenal and answering questions live. The original presentation of ATT&CK Simulator was at a SANS Summit and the slides are available here. Tim, Kyle, and David can be found on Twitter, give them a shout out for this amazing work!
Splunk Integration
SCYTHE is easily integrated with Spunk by filling out three fields in the “Administration - Settings” menu as shown in Figure 1 (screenshot from SCYTHE Administrator Guide):
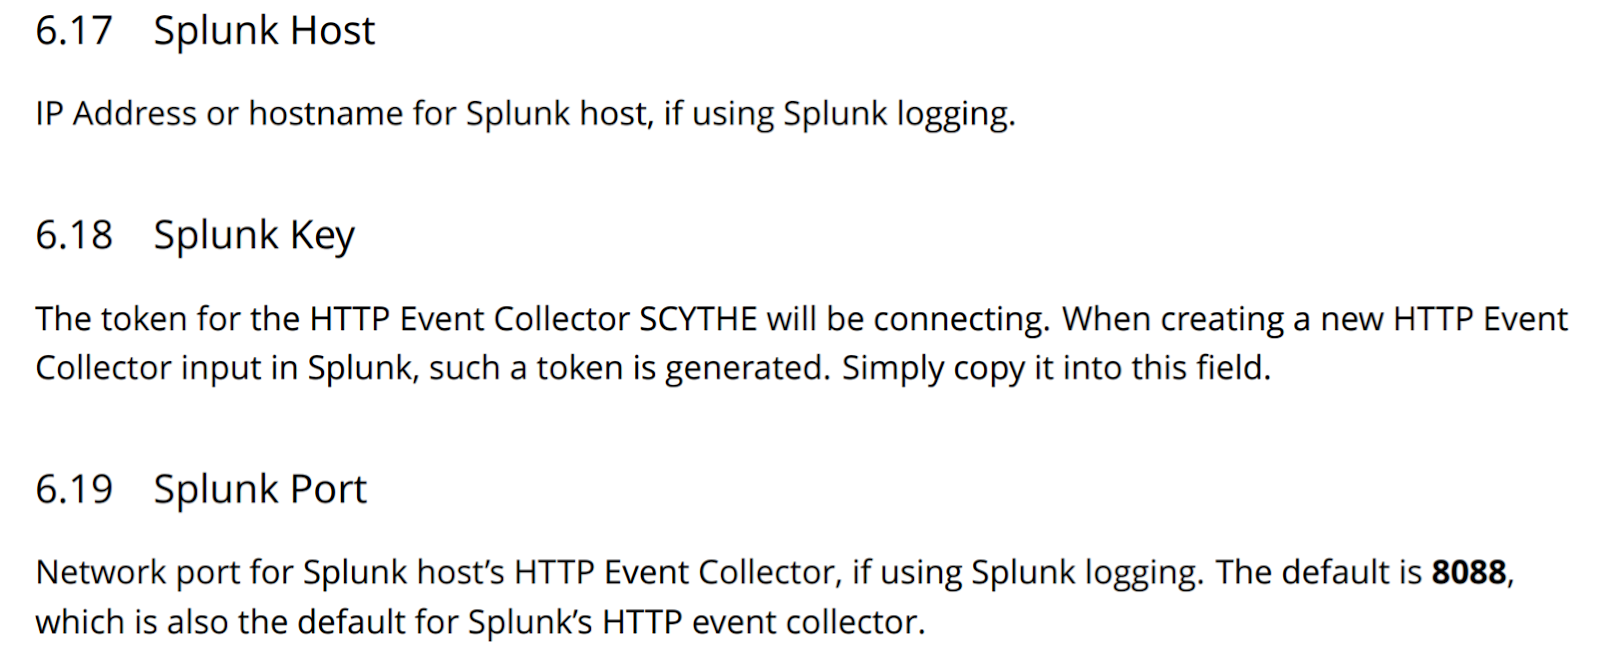
The Splunk Host, Key, and Port information comes straight from your Splunk instance’s HTTP Event Collector. The Administration Guide you receive when you purchase SCYTHE provides a step-by-step walkthrough. For completeness, these are the steps:
- If you do not have Splunk, setup an account at www.splunk.com, and download, install and launch Splunk Enterprise. Initially sign in with the username admin and password changeme.
- From the main Explore Splunk screen, select Add Data.
- From the Add Data screen, select monitor.
- Select HTTP Event Collector (at left side of the window).
- Select a HTTP Event Collector name such as SCYTHE and accept defaults for all other fields and click Next, Review and Submit.
- Save the Token Value from the next screen that will be used as the splunk_key within the SCYTHE System Settings screen.
- From the main Splunk dashboard, click Settings->Data inputs and select HTTP Event Collector.
- The HTTP Event Collector screen should list the event collector that was just created but will initially be Disabled. Click Global Settings, select Enabled and Save.
- Login into SCYTHE and select the Client Settings screen
- Enter the TCP/IP address for the Splunk host, the Splunk Token Value for the SCYTHE splunk_key and the appropriate port for splunk_port (default is 8088).
- Click Update, Logout and Log back into SCYTHE.
To view collected SCYTHE event data within Splunk, perform the following steps:
- Launch Splunk Enterprise and login
- Select Search & Reporting
- Login to SCYTHE, launch a campaign and run a few shell commands such as ‘run ipconfig’, enumwindows, processes, etc.
- From the Splunk Search screen, you should notice that a number of events are now available (under the What to Search heading)
- Select Data Summary which should present the Host from where the event data was collected from.
- Select the Host to view the action taken on that host.
About SCYTHE
SCYTHE provides an advanced attack emulation platform for the enterprise and cybersecurity consulting market. The SCYTHE platform enables Red, Blue, and Purple teams to build and emulate real-world adversarial campaigns in a matter of minutes. Customers are in turn enabled to validate the risk posture and exposure of their business and employees and the performance of enterprise security teams and existing security solutions. Based in Arlington, VA, the company is privately held and is funded by Gula Tech Adventures, Paladin Capital, Evolution Equity, and private industry investors. For more information email info@scythe.io, visit https://scythe.io, or follow on Twitter @scythe_io.
Latest Posts

MuddyWater Displaying New Tactics and Intriguing Malware
March 20,2026

Key Takeaways from UniCon 2025 – Fall Edition
September 28,2025
Related Articles